
The ATI TEAS Math Measurement and Data section can be difficult, but with a little preparation, you can boost your scores.
In this blog post, we will discuss some tips that will help you improve your performance on the exam. We will cover topics such as measurement, data interpretation, and problem-solving.
Follow these tips and you will be ready to ace the ATI TEAS Math Measurement and Data section!
Objectives for Measurement and Data
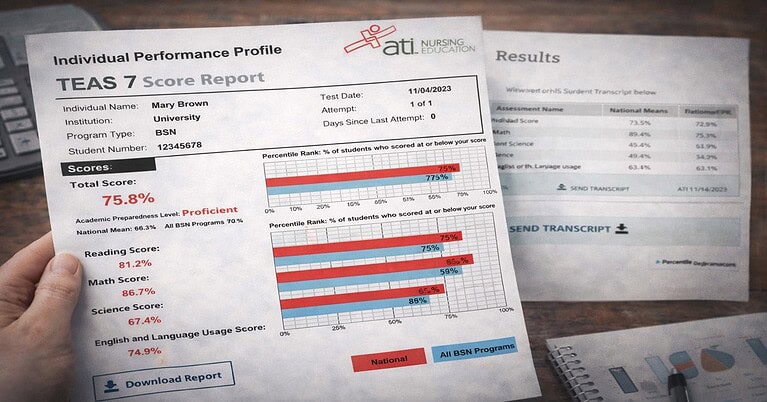
Total scored items on ATI TEAS: 16 questions out of 34
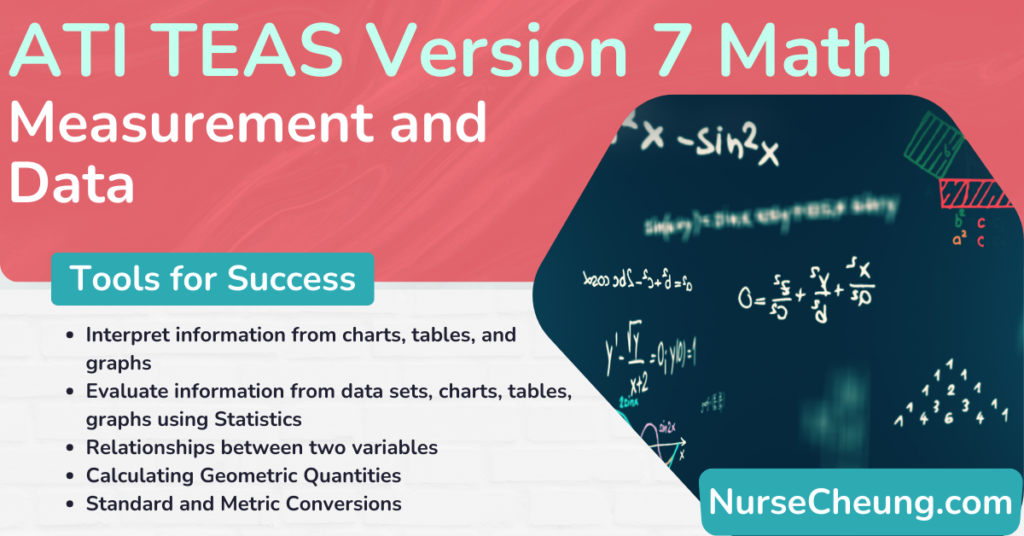
Interpret Information from Charts, Tables, and Graphs
Types of Graphical displays
The ATI TEAS will use a variety of graphical displays and you must have the ability to interpret information from charts, tables, and graphs.
Some of the displays you may see include:
- Cartesian coordinate graphs: These graphs will have a pair of perpendicular lines, called axes, that intersect at a point called the origin. The axes are used to locate points on the graph.
- Scatter plots: A scatter plot is a graph that shows the relationship between two variables. The variables are plotted as points on the graph and the relationship between the variables is shown.
- Line graphs: A line graph is a graph that shows information that changes over time.
- Pie charts: A pie chart is a graph that is broken into sectors that each represent a proportion of a whole.
- Bar graphs: A bar graph is a diagram in which numerical values of variables are represented by the height or length of rectangles.
How to interpret graphs and tables
When you are looking at a graph or table, it is important to be able to identify the following:
- The title of the graph or table: This will give you an idea of what the data is about.
- The axes: The x-axis (horizontal axis) and y-axis (vertical axis) will tell you what the variables are.
- The data: The data is what is being plotted on the graph or listed in the table.
- The scale: The scale is the range of values that are being used.
- The units: The units are the measurements that are being used.
- The trend: The trend is the overall pattern of the data.
- The quadrant: The quadrant is the area of the graph that is divided by the axes.
Evaluate the information of Data Sets, Charts, Tables, and Graphs using Statistics
Mean, Median, and Mode
The mean is the average of a set of numbers. To find the mean, add all of the numbers together and then divide by the number of items in the set.
An example of finding a mean is as follows: You have a set of numbers: {12, 13, 14, 15, 16}
To find the mean, add the numbers together: 12 + 13 + 14 + 15 + 16 = 70
Then, divide by the number of items in the set: 70 / 5 = 14
The median is the middle number in a set of numbers. To find the median, arrange the numbers from least to greatest and then find the number that is in the middle of the set.
To find the median, arrange the numbers in order from least to greatest: {12, 13, 14, 15, 16}
The median is the middle number: 14
The mode is the number that occurs most often in a set of numbers. To find the mode, arrange the numbers from least to greatest and then find the number that occurs most often.
An example of finding a mode is as follows: You have a set of numbers: {12, 12, 13, 14, 15, 16}
To find the mode, arrange the numbers in order from least to greatest: {12, 12, 13, 14, 15, 16}
The mode is the number that occurs most often: 12
Understanding Range
The range is measured by finding the difference between the largest and smallest values in a data set. To find the range, subtract the smallest value from the largest value.
An example of finding the range is as follows: You have a set of numbers: {12, 13, 14, 15, 16}
To find the range, subtract the smallest value from the largest value: 16 – 12 = 4.
The range is four.
Data Ranges can also be classified by how points are plotted on a graph. Examples of this include standard deviation, symmetry, number of peaks, and skewness.
- Standard deviation describes how spread out data is from the mean. A low standard deviation means that most of the data is close to the mean, while a high standard deviation means that the data is spread out from the mean.
- Symmetry occurs when data is equally distributed on either side of a line or point.
- The number of peaks occurs when data has multiple local maxima or minima. Data can be unimodal (one peak or bell-shaped) or bimodal (two peaks).
- Skewness occurs when data is not equally distributed on either side of a line or point. Data can be right-skewed (most of the data is on the right side of the graph), left-skewed (most of the data is on the left side of the graph), and uniform (the data is equally spread out across the graph).
Interpreting trends on graphs and tables
When looking at trends on graphs and tables, it is important to be able to identify the following:
- The type of trend: The types of trends include linear, exponential, and quadratic.
- The direction of the trend: The direction of the trend can be positive (increasing), negative (decreasing), or no change (flat).
- The rate of change: The rate of change is the amount that the trend is increasing or decreasing by.
An example of interpreting a trend is as follows: You have a graph with the following data points: (0,0), (0, -.25), (0, -.50), (0,-.75)
The type of trend is linear.
The direction of the trend is negative.
The rate of change is .25.
This means that for every increase of one unit, the trend decreases by .25 units.
There are also data points that are outliers. An outlier is a data point that is far from the other data points in the set.
An example of an outlier is as follows: You have a set of numbers: {12, 13, 14, 15, 16}
One data point is 50.
The outlier is 50.
Understanding Probability
Probability is the chance that an event will occur. Probability can be expressed as a fraction, decimal, or percentage.
P(event) = (number of desired outcomes)/(total number of outcomes)
An example of probability is as follows: The probability of rolling a six on a dice is one out of six, or .16666667. This can also be written as a decimal, which would be .1667.
The Relationships between Two Variables
Dependent and Independent Variables
The dependent variable is the outcome of an experiment or the value that is being measured. This variable is “dependent” on that of another.
The independent variable is the one that does not depend on that of another.
This can also be classified as the cause (independent variable) and effect (dependent variable).
For example, in an experiment to see how different amounts of light affect plant growth, the dependent variable would be the height of the plant, while the independent variable would be the amount of light.
Correlation
Correlation or covariance is a statistical measure that describes the relationship between two variables.
There are three types of correlations: positive, negative, and no correlation.
- A positive correlation means that as one variable increases, the other variable also increases.
- A negative correlation means that as one variable increases, the other variable decreases.
- No correlation means that there is no relationship between the two variables.
An example of a positive correlation is as follows: As the temperature outside increases, so do the ice cream sales.
An example of a negative correlation is as follows: As the price of gas increases, the number of miles driven per week decreases.
An example of no correlation is as follows: The number of hours of sleep per night has no correlation with the grade on a test.
Comparing and Contrasting Direct and Inverse Relationships
A direct relationship or direct variation is a straight line relationship in which the dependent variable increases as the independent variable increases. For example, y=mx.
An inverse relationship is a curved line relationship in which the dependent variable decreases as the independent variable increases. For example, y=m/x.
Calculate Geometric Quantities
Perimeter and Circumference
The perimeter is the distance around a two-dimensional shape. The formula for perimeter is P=s+s+s… (where s stands for the length of each side).
To find the perimeter of a complex shape, add all the lengths of each side together.
The circumference is the distance around a circle. The formula for circumference is C=πd (where d stands for the diameter of the circle).
Area
The area is the amount of two-dimensional space that a shape covers. The formula for area varies depending on the shape.
- To find the area of a rectangle, use the formula A=lw (where l stands for length and w stands for width).
- To find the area of a triangle, use the formula A=½bh (where b stands for base and h stands for height).
- To find the area of a circle, use the formula A=πr² (where r stands for radius).
- To find the area of a parallelogram, use the formula A=hb (where h stands for height and b stands for base)
- To find the area of a trapezoid, use the formula A=½h(b1 + b2) where h stands for height, b1 stands for the smallest base, and b2 stands for the largest base.
Volume
The volume is the amount of three-dimensional space that a shape takes up. The formula for volume varies depending on the shape.
- To find the volume of a rectangular prism, use the formula V=lwh (where l stands for length, w stands for width, and h stands for height).
- To find the volume of a triangular prism, use the formula V=bhl/2 (where b stands for the base, h stands for the height, and l stands for length)
- To find the volume of a cylinder, use the formula V=πr²h (where r stands for radius and h stands for height).
- To find the volume of a rectangular pyramid, use the formula V=⅓lwh (where l stands for length, w stands for width, and h stands for height).
- To find the volume of a cone, use the formula V=⅓πr²h (where r stands for radius and h stands for height).
Convert between Standard and Metric Systems
Standard System
In the United States, the standard system is used to measure length, capacity, and weight.
The most common units of length are inches, feet, yards, and miles.
The most common units of capacity are teaspoons, tablespoons, cups, pints, quarts, and gallons.
The most common units of weight are ounces and pounds.
How to use dimensional analysis to convert units
- Determine what you are converting. In this case, we are converting length from inches to feet.
- Determine the relationship between the units. In this case, there are 12 inches in one foot.
- Set up the equation. In this case, it would be 12 inches = x feet.
- Solve the unknown unit. In this case, x = 12/12 feet or x = one foot.
This same process can be used to convert between any units in the standard system.
Metric System
In many other countries, the metric system is used to measure length, capacity, and weight.
The most common units of length are millimeters, centimeters, meters, and kilometers.
The most common units of capacity are milliliters and liters.
The most common units of weight are grams and kilograms.
The metric system is based on the powers of ten. This means that each unit is ten times larger or smaller than the one before or after it.
For example, one meter is ten times larger than one decimeter and one hundred times larger than one centimeter.
This means that to convert from a larger unit to a smaller unit, you will need to move the decimal point to the left.
For example, to convert from centimeters to meters, you would move the decimal point two places to the left (100 cm = .01 m).
To convert from a smaller unit to a larger unit, you will need to move the decimal point to the right.
For example, to convert from millimeters to centimeters, you would move the decimal point one place to the right (.001 m = 1000 mm).
Converting between standard and metric systems
When converting between the standard and metric systems, it is important to know the equivalents between the units.
For example, 1 gallon is equal to 3.8 liters.
Common conversions you may see on the ATI TEAS include
- 1 kilogram (kg) = 2.2 pounds (lbs)
- 1 inch (in) = 2.54 centimeters (cm)
- 1 meter (m) = 3.28 feet (ft)
- 1 ounce (oz) = 28.5 grams (g)
- 1 mile (mi) = 1.6 kilometers (km)