Skip to content
My Story
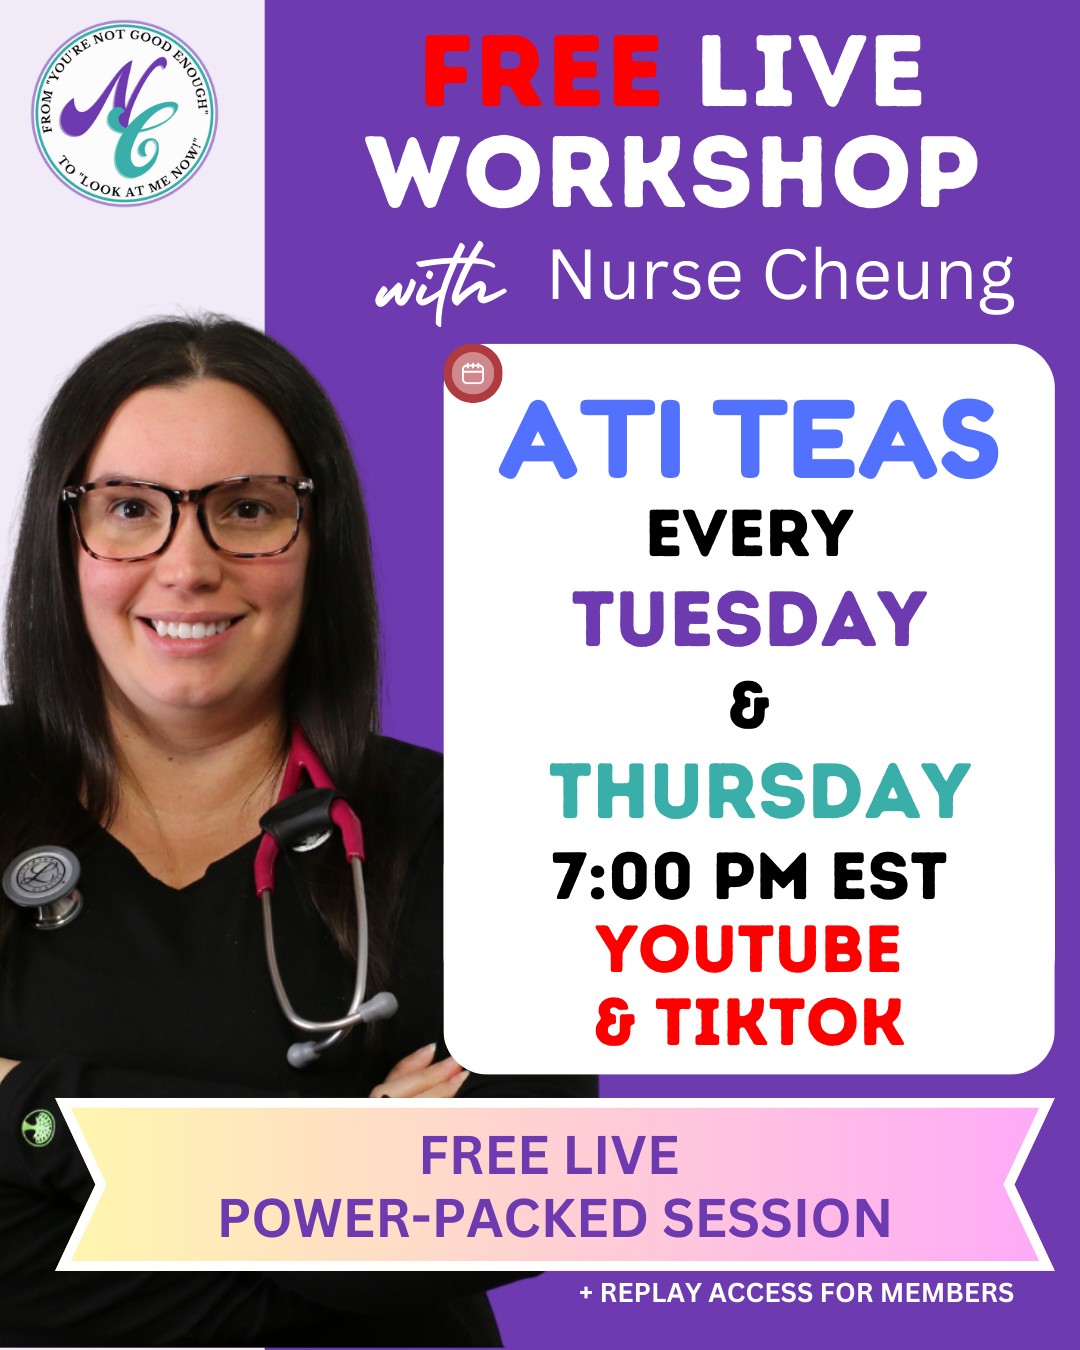
ATI TEAS
AHA Certification
Amazon
Shop
Contact
Hamburger Toggle Menu
Search
Search
Youtube
Facebook
Instagram
Tiktok
Linkedin
My Story
ATI TEAS
AHA Certification
Amazon
Shop
Contact
Hamburger Toggle Menu
Search
Search
Youtube
Facebook
Instagram
Tiktok
Linkedin
404
The page you were looking for couldn't be found
HOME
About
AMAZON
SHOP
Contact Us
Youtube
Facebook-f
Tiktok
Signup for our newsletter
SIGN UP
Subscribe to receive the Nurse Cheung Newsletter, NurseCheung Store news, and more!